Globo Logger
Revitalizing the
way of logging,
23 years later
Since 2002, loggers have used Losys to record Big Brother Brasil metadata in real-time. However, with no updates over the years, the system faced severe technological and usability limitations. Additionally, bad experiences with other market options made our journey to create the ideal solution for these users even more challenging.
My job was to deeply understand these users and develop a new application to replace Losys, featuring a modern, scalable interface highly tailored to user needs. The project not only gained the trust of loggers but also transformed Globo Logger into a modular and profitable solution usable beyond BBB.
Big Brother Brasil

The Challenge
Since its debut in 2002, the previous application was a central tool for loggers, but it became outdated and presented critical challenges that compromised user efficiency and satisfaction:
Obsolete Technology
Designed in 2002 for 4:3 monitors, Losys hadn't received any interface updates since its inception, ignoring technological advancements and current logger needs.
Poor Usability
Besides being outdated, its column-based layout made component reading difficult, increasing cognitive load, especially during time-sensitive tasks.
Lack of Scalability
Limited to only 12 participants, it no longer supported the program's scale. Dependence on third parties for basic adjustments delayed and complicated processes.
Resistance to Change
Previous attempts to replace Losys failed, frustrating users and creating significant distrust in new solutions, adding to the challenge.
Faced with tight deadlines and a significant challenge, I needed to create an intuitive application with a short learning curve a scalable tool with a direct impact on logger productivity.
My Role
As Senior UX Designer, I led the application's design through every stage. My key contributions included:
01
User Research
I conducted a deep immersion in the loggers' work environment to observe their routines, challenges, and interactions with the application. Through in-depth interviews and empathy maps, I gained valuable insights into factors like lighting, ergonomics, and interface inflexibility that impacted usability.
02
Data Analysis and Pain Point Identification
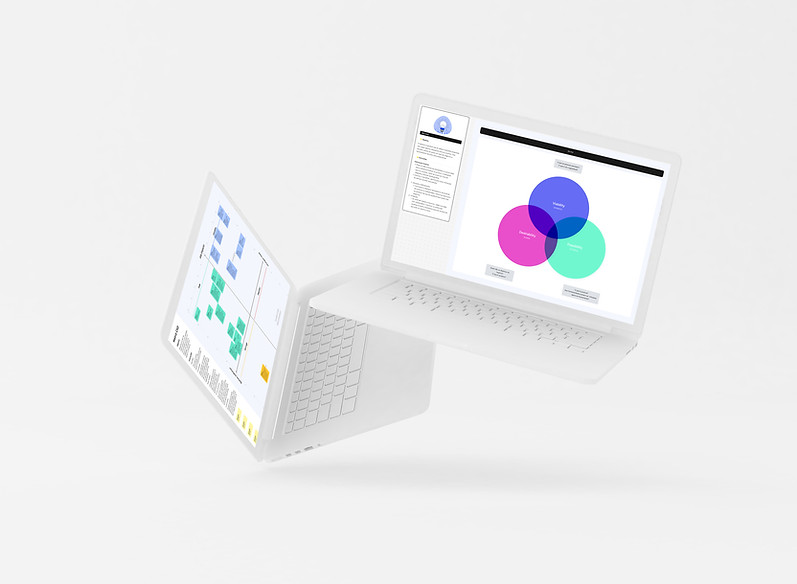
Using tools like the CSD matrix, I structured findings and prioritized critical issues, such as high cognitive load from the column layout, dependence on third parties, and user resistance due to previous failed solutions.
03
User-Centered Design
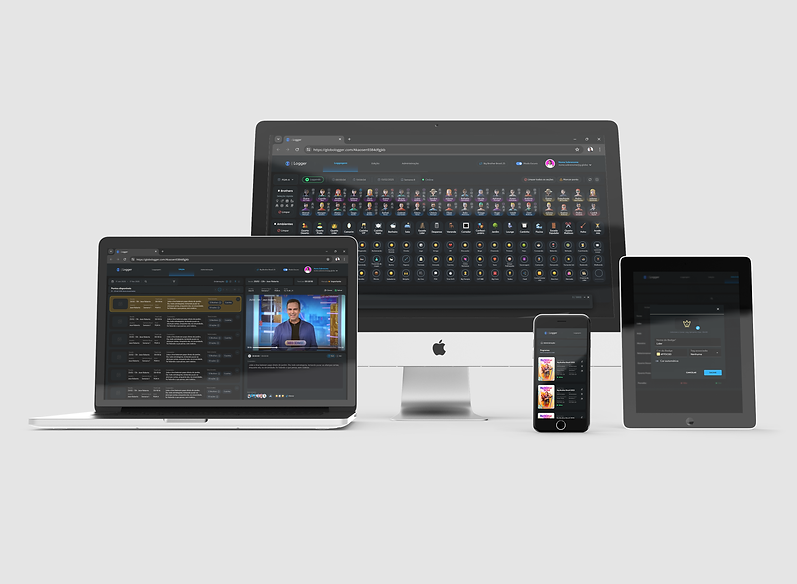
I developed a horizontal lane layout prioritizing a "Z" reading pattern to reduce cognitive load. I implemented a modular interface with adaptive functionalities, such as light/dark modes, movable and resizable text boxes, and touchscreen compatibility tailored to user needs.
04
Scalability Strategy
I transformed the application into a modular, scalable, and sellable solution, designed to support not just BBB but other programs and formats, with easy maintenance allowing users to manage the application and registered programs independently.
05
Prototyping and Continuous Validation
I developed interactive Figma prototypes validated through A/B testing and usability sessions, ensuring the application met expectations. Iterations led to significant improvements, such as quick-action buttons on lanes, optimized color schemes for visual comfort, and prioritizing high-impact MVP functionalities aligned with the product roadmap.
06
Post-Launch Support and Follow-Up
I closely collaborated with stakeholders and developers during implementation, documenting the process to facilitate future maintenance. Post-launch, I supported users to ensure a smooth transition. The learning curve was minimal, with veteran loggers training newcomers on the first day of use, highlighting the solution's effectiveness.
Processes
Environment Immersion
I carried out an analysis of the work environment, considering aspects such as lighting, ergonomics and task flow.
Empathy Maps
Created empathy maps to capture user perspectives and deepen understanding of their needs and expectations.
Interviews and Surveys
Conducted interviews with loggers to understand their routines, challenges, and frustrations with the current application.
Data Analysis
Identified usage patterns and friction points using the CSD matrix to prioritize issues and align the team.

Usability Testing
Conducted sessions to identify improvements in information hierarchy, navigation, and features.
Value Discovery
Organized workshops to map high-impact, low-effort features and ensure alignment with strategic product goals.
Product Discovery
Facilitated workshops to define the system's scope and objectives.
Benchmarking
Evaluated competitor tools and applications mentioned by loggers to enrich the product with best practices.

Modular Layout
Redesigned with horizontal lanes, optimizing the "Z" reading pattern and reducing cognitive load.
Light and Dark Modes
Developed modes tailored to work conditions, reducing visual fatigue and accommodating user preferences.
Personalization
Introduced movable and resizable boxes, enabling users to adapt the interface to their individual needs.
Design Tokens and Dynamic Palette
Centralized color management using tokens, aligning light and dark modes with accessibility standards.

Interactive Prototyping
Developed high-fidelity interactive prototypes in Figma, tested in rapid cycles to validate ideas.
Advanced Management
Integrated real-time adjustments for adding, removing, or reorganizing items without developer dependence.
Scalable Design
Planned as a modular, reusable solution for other programs beyond BBB.
Interactive tests
Conducted testing cycles with users at various experience levels to ensure intuitive use.

Continuous Feedback
Maintained an open channel with loggers throughout the process, ensuring their input guided design decisions.
Visual Impact Analysis
Conducted comparisons between the old and new designs to evaluate the efficiency of the new visual hierarchy and ensure readability in different conditions.
Multi-Device Compatibility
Ensured the application was responsive and functional on widescreen monitors and touchscreen devices.
Simplified Onboarding
Developed an onboarding experience that allowed veteran loggers to train new colleagues on the first day of use without complex instructions.


APRENDIZADOS E IMPACTO
Este projeto demonstrou o poder de um design centrado no usuário aliado a uma estratégia clara e bem direcionada. A colaboração entre a equipe, o uso de metodologias ágeis e a aplicação de boas práticas de acessibilidade foram fundamentais para transformar um produto deficitário em um canal de vendas estratégico. Este case me ensinou que ouvir o usuário, iterar continuamente e manter um alinhamento entre todas as partes interessadas são elementos essenciais para o sucesso.

Impressive Results
97%
Approval from Loggers
Loggers reported high satisfaction with the new interface, with 97% preferring the updated system over the previous version.
40%
Reduction in Refinement
The more efficient refinement module significantly reduced the average time required for data adjustments and enrichment.
100%
Independence
The new module provided full autonomy to manage participants, actions, and workflows, eliminating developer reliance.
38%
Cost Savings
By eliminating the need for the Losys license and hosting costs of Globo Logger, savings reached R$ 50,000 per month.

APRENDIZADOS E IMPACTO
Este projeto demonstrou o poder de um design centrado no usuário aliado a uma estratégia clara e bem direcionada. A colaboração entre a equipe, o uso de metodologias ágeis e a aplicação de boas práticas de acessibilidade foram fundamentais para transformar um produto deficitário em um canal de vendas estratégico. Este case me ensinou que ouvir o usuário, iterar continuamente e manter um alinhamento entre todas as partes interessadas são elementos essenciais para o sucesso.

Increased
Productivity
Loggers reported greater efficiency and comfort with the new interface, along with easier management.
Engagement
and High Acceptance
Users felt valued and engaged by actively participating in the development process.
Recognition
and Internal Triumph
The tool gained prominence within Globo, enabling team growth, attracting new talent, and creating a new hierarchy.
Reduced
Learning Curve
On the first day of use, veteran loggers trained newcomers, highlighting the intuitive design and ease of use.

APRENDIZADOS E IMPACTO

Learnings and Impact
This project emphasized the importance of user-centered decision-making, particularly in contexts of resistance to change. Combining in-depth research, quick iterations, and continuous validation was crucial for creating a solution that met technical needs and earned user trust.
The interdisciplinary collaboration and use of agile methodologies were vital for aligning teams and prioritizing issues. Furthermore, the modular design of Globo Logger opened new strategic opportunities for broader applications.
Ultimately, this case demonstrates my ability to transform outdated systems into scalable, user-centered solutions.
thank u!
This case demonstrates my ability to transform outdated systems into scalable, user-centered solutions.
If you're looking for a professional focused on innovation and results, let’s talk!